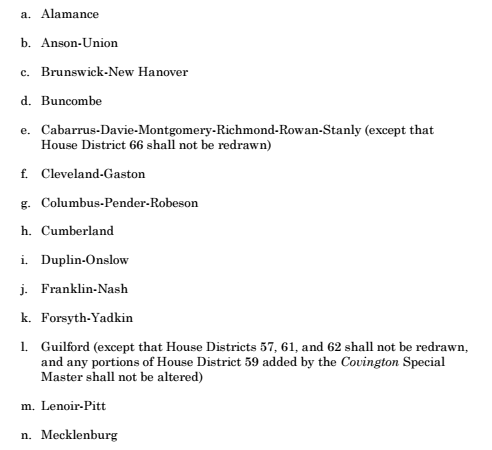
As a reminder, the court held that the legislature had engaged in partisan gerrymandering with the state legislative district maps, and ordered the General Assembly to redraw the district maps containing the following counties in the state house:
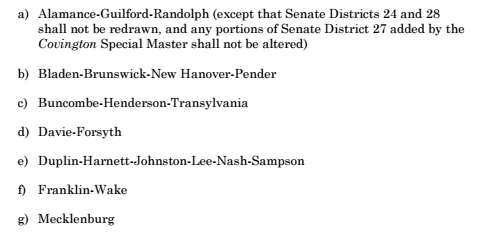
And these counties in the state senate:
Using the website PlanScore.org and its capability of uploading shape files to be scored/analyzed, I used a classification based on PlanScore's analysis of the districts and predicted vote shares for both parties (based on 2016 election data compiled by PlanScore). My classification system is:
- Those districts with greater than 60 percent for one party: "likely" party district
- Those districts with between 55 and 60 percent vote share for one party: "lean" party district
- Those districts with between 50 and 55 percent vote share for one party: "competitive but favor one party" district
A few reminders before reading much further: the following analysis only paints the districts as potentially within one of these six categories based on 2016 election data. As I discussed yesterday on Twitter in a length thread, my interest is in 'explaining' and understanding how politics works, and one of my research interests is in North Carolina redistricting, electoral behavior, and voting patterns. For those partisans and political operatives who want to 'read' into these classifications that their party will win, have fun: that's not my job. Again, as I indicated in the Twitter thread, my job is to help educated and hopefully provide context and analysis to understanding North Carolina politics. This redistricting is a major component of North Carolina politics, and thus my analysis hopefully gives a sense of where things stand in these districts in a '2016-based' performance.
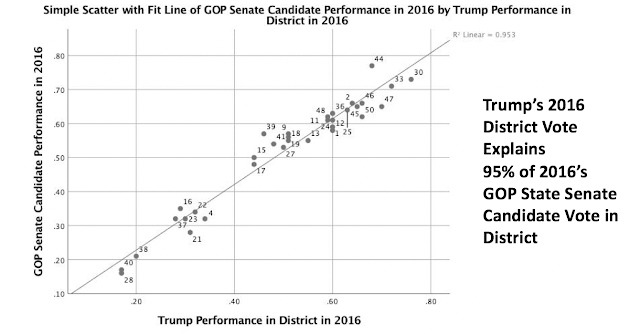
And as I have documented before, North Carolina voting patterns have become more consistent in party 'loyalty,' with voters tending to vote straight ticket down the ballots. For example, here is the relationship between Trump vote performances in the state senate districts in 2016 with GOP NC House candidate vote performance:
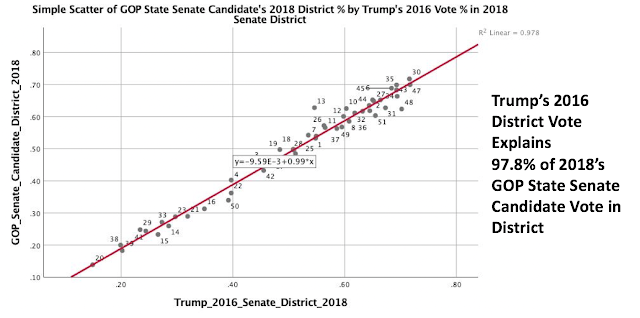
And then using Trump's 2016 vote performance against the GOP state senate candidate's 2018 vote performance:
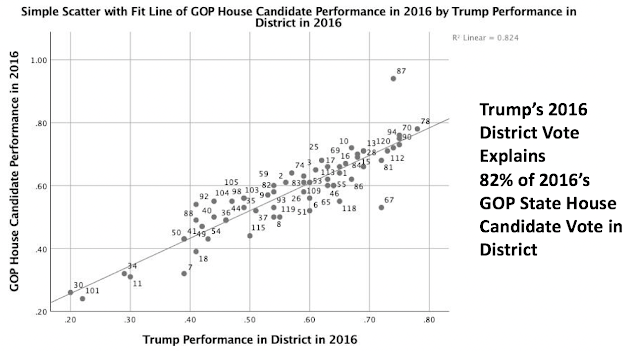
For the 2016 elections' vote performance by both Trump and the GOP state house candidate, a slightly less of a relationship is indicated:
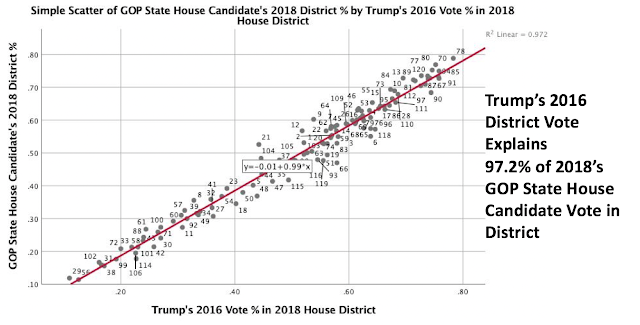
However, in looking at the 2018 GOP state house candidate's performance against Trump's 2016 vote performance in the same district, the relationship strengthened considerably:
So there could be a relationship between 2016 presidential vote patterns and North Carolina state legislative vote patterns (thanks to strengthening voter loyalty and electoral partisanship), but as I mentioned yesterday, every election is different, so 2020 will likely not be like 2016. So take the following data with that understanding.
With that said, here's the two chambers' analyses and PlanScore data:
State House Analysis
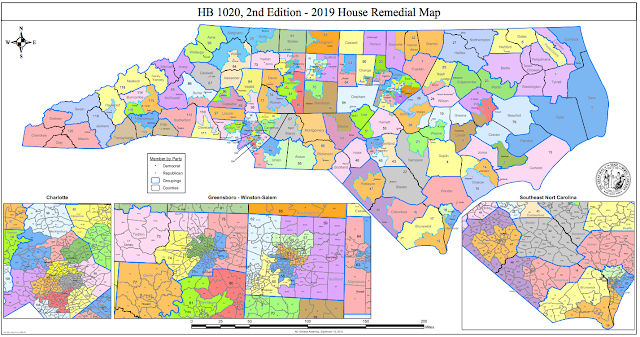
First, the 120-member State House of Representatives, which the proposed map and the new districts are:
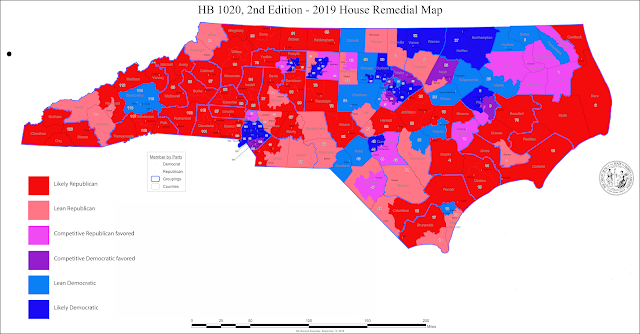
The 'political' data incorporated into the district maps paints a state that looks like this for the lower chamber in the North Carolina General Assembly:
In taking each category/classification, twenty-eight (28) of the House districts could be considered "likely Democratic" districts, since their predicted Democratic vote share is above 60 percent. Barring a tremendous tsunami-wave election or significant individual district factor, it's unlikely that these seats would flip to Republicans.
| District | Predicted Democratic Vote Share | Predicted Republican Vote Share | Classification | GOP Difference to 2018 | |
| 29 | 84.30% | 15.70% | Likely Democratic | 0.00% | |
| 56 | 83.30% | 16.70% | Likely Democratic | 0.00% | |
| 106 | 79.70% | 20.30% | Likely Democratic | -5.80% | |
| 31 | 79.50% | 20.50% | Likely Democratic | 0.00% | |
| 38 | 79.00% | 21.00% | Likely Democratic | 0.00% | |
| 102 | 79.00% | 21.00% | Likely Democratic | 0.50% | |
| 107 | 73.30% | 26.70% | Likely Democratic | 1.90% | |
| 100 | 72.20% | 27.80% | Likely Democratic | -4.90% | |
| 58 | 72.10% | 27.90% | Likely Democratic | 0.70% | |
| 61 | 71.80% | 28.20% | Likely Democratic | 0.00% | |
| 101 | 70.70% | 29.30% | Likely Democratic | 3.50% | |
| 71 | 70.50% | 29.50% | Likely Democratic | -0.50% | |
| 72 | 70.40% | 29.60% | Likely Democratic | 5.60% | |
| 92 | 70.40% | 29.60% | Likely Democratic | -4.10% | |
| 30 | 70.10% | 29.90% | Likely Democratic | 0.00% | |
| 44 | 70.00% | 30.00% | Likely Democratic | -16.50% | |
| 33 | 68.70% | 31.30% | Likely Democratic | 5.20% | |
| 11 | 67.30% | 32.70% | Likely Democratic | -1.20% | |
| 57 | 66.30% | 33.70% | Likely Democratic | 0.00% | |
| 49 | 65.60% | 34.40% | Likely Democratic | -2.00% | |
| 39 | 64.70% | 35.30% | Likely Democratic | 0.00% | |
| 42 | 64.30% | 35.70% | Likely Democratic | 6.70% | |
| 88 | 63.80% | 36.20% | Likely Democratic | 8.40% | |
| 60 | 62.40% | 37.60% | Likely Democratic | 5.00% | |
| 32 | 62.10% | 37.90% | Likely Democratic | 0.00% | |
| 99 | 62.10% | 37.90% | Likely Democratic | 15.10% | |
| 8 | 61.20% | 38.80% | Likely Democratic | 4.30% | |
| 27 | 60.40% | 39.60% | Likely Democratic | 0.00% |
Next are the "lean Democratic" districts, which number thirteen (13).
| District | Predicted Democratic Vote Share | Predicted Republican Vote Share | Classification | GOP Difference to 2018 | |
| 41 | 59.10% | 40.90% | Lean Democratic | 2.10% | |
| 54 | 58.80% | 41.20% | Lean Democratic | 0.00% | |
| 115 | 58.10% | 41.90% | Lean Democratic | -9.20% | |
| 23 | 57.40% | 42.60% | Lean Democratic | 0.00% | |
| 34 | 57.30% | 42.70% | Lean Democratic | 6.20% | |
| 116 | 56.90% | 43.10% | Lean Democratic | -11.60% | |
| 18 | 56.50% | 43.50% | Lean Democratic | 1.20% | |
| 50 | 56.40% | 43.60% | Lean Democratic | 0.00% | |
| 114 | 56.10% | 43.90% | Lean Democratic | 17.60% | |
| 24 | 55.80% | 44.20% | Lean Democratic | 0.00% | |
| 5 | 55.70% | 44.30% | Lean Democratic | 0.00% | |
| 21 | 55.30% | 44.70% | Lean Democratic | 0.00% | |
| 48 | 55.30% | 44.70% | Lean Democratic | 0.00% |
Again, it would take a wave election to perhaps break into these seats with GOP victories, but it could happen under the right circumstances (think 2010's Tea Party insurgency).
Next are the 'competitive but Democratic favored' districts, which are eight (8).
| District | Predicted Democratic Vote Share | Predicted Republican Vote Share | Classification | GOP Difference to 2018 | |
| 40 | 54.00% | 46.00% | Competitive Lean Democratic | -3.00% | |
| 104 | 53.40% | 46.60% | Competitive Lean Democratic | -0.60% | |
| 105 | 53.40% | 46.60% | Competitive Lean Democratic | -3.50% | |
| 25 | 53.10% | 46.90% | Competitive Lean Democratic | 0.70% | |
| 36 | 52.00% | 48.00% | Competitive Lean Democratic | -5.00% | |
| 103 | 51.60% | 48.40% | Competitive Lean Democratic | -6.00% | |
| 35 | 50.60% | 49.40% | Competitive Lean Democratic | -0.90% | |
| 9 | 50.30% | 49.70% | Competitive Lean Democratic | -6.10% |
Three of these districts are centered in south Mecklenburg County, which is experiencing a significant shift in voter behavior from solidly Republican to lean Democratic.
All total, there are potentially 49 House districts that, in normal political environments (replicate 2016's presidential election), would likely be in the Democratic column.
Next are the ten (10) 'competitive but Republican favored' districts:
| District | Predicted Democratic Vote Share | Predicted Republican Vote Share | Classification | GOP Difference to 2018 | |
| 43 | 49.30% | 50.70% | Competitive Lean Republican | 20.20% | |
| 63 | 49.20% | 50.80% | Competitive Lean Republican | -3.50% | |
| 45 | 49.00% | 51.00% | Competitive Lean Republican | -7.50% | |
| 47 | 48.40% | 51.60% | Competitive Lean Republican | 4.90% | |
| 1 | 47.50% | 52.50% | Competitive Lean Republican | 0.00% | |
| 12 | 47.20% | 52.80% | Competitive Lean Republican | 0.70% | |
| 37 | 47.10% | 52.90% | Competitive Lean Republican | 0.70% | |
| 98 | 45.80% | 54.20% | Competitive Lean Republican | 0.00% | |
| 59 | 45.60% | 54.40% | Competitive Lean Republican | -4.50% | |
| 74 | 45.50% | 54.50% | Competitive Lean Republican | -3.20% |
Next are the seventeen (17) lean Republican districts:
| District | Predicted Democratic Vote Share | Predicted Republican Vote Share | Classification | GOP Difference to 2018 | |
| 82 | 44.30% | 55.70% | Lean Republican | -1.60% | |
| 55 | 44.20% | 55.80% | Lean Republican | -7.60% | |
| 22 | 43.80% | 56.20% | Lean Republican | 0.00% | |
| 51 | 43.50% | 56.50% | Lean Republican | 0.00% | |
| 46 | 42.90% | 57.10% | Lean Republican | -5.30% | |
| 119 | 42.60% | 57.40% | Lean Republican | 0.00% | |
| 7 | 42.50% | 57.50% | Lean Republican | -0.30% | |
| 2 | 42.30% | 57.70% | Lean Republican | 0.00% | |
| 20 | 42.10% | 57.90% | Lean Republican | 0.40% | |
| 62 | 42.10% | 57.90% | Lean Republican | 0.00% | |
| 83 | 41.80% | 58.20% | Lean Republican | 0.10% | |
| 93 | 41.70% | 58.30% | Lean Republican | 0.00% | |
| 76 | 41.50% | 58.50% | Lean Republican | -3.40% | |
| 3 | 41.20% | 58.80% | Lean Republican | 0.00% | |
| 66 | 40.50% | 59.50% | Lean Republican | 0.00% | |
| 19 | 40.10% | 59.90% | Lean Republican | 2.20% | |
| 64 | 40.10% | 59.90% | Lean Republican | 3.10% |
Finally, the plurality of districts within the 120-seat chamber are considered "likely Republican" districts, at forty-four (44):
| District | Predicted Democratic Vote Share | Predicted Republican Vote Share | Classification | GOP Difference to 2018 | |
| 111 | 38.80% | 61.20% | Likely Republican | -6.30% | |
| 26 | 38.60% | 61.40% | Likely Republican | 0.00% | |
| 53 | 38.60% | 61.40% | Likely Republican | 0.00% | |
| 16 | 38.10% | 61.90% | Likely Republican | 1.10% | |
| 117 | 38.10% | 61.90% | Likely Republican | 0.00% | |
| 14 | 37.90% | 62.10% | Likely Republican | 0.00% | |
| 79 | 37.90% | 62.10% | Likely Republican | 0.00% | |
| 108 | 37.90% | 62.10% | Likely Republican | 0.50% | |
| 52 | 37.70% | 62.30% | Likely Republican | 0.00% | |
| 75 | 37.60% | 62.40% | Likely Republican | 6.10% | |
| 96 | 37.40% | 62.60% | Likely Republican | 0.00% | |
| 109 | 37.30% | 62.70% | Likely Republican | 3.00% | |
| 65 | 37.20% | 62.80% | Likely Republican | 0.00% | |
| 113 | 37.20% | 62.80% | Likely Republican | 0.00% | |
| 4 | 36.50% | 63.50% | Likely Republican | -0.50% | |
| 17 | 36.50% | 63.50% | Likely Republican | -2.20% | |
| 73 | 35.70% | 64.30% | Likely Republican | -2.00% | |
| 68 | 35.50% | 64.50% | Likely Republican | 4.40% | |
| 69 | 35.50% | 64.50% | Likely Republican | 2.50% | |
| 6 | 35.30% | 64.70% | Likely Republican | 0.00% | |
| 118 | 35.10% | 64.90% | Likely Republican | 0.00% | |
| 10 | 34.30% | 65.70% | Likely Republican | 0.00% | |
| 28 | 34.10% | 65.90% | Likely Republican | 0.00% | |
| 95 | 33.60% | 66.40% | Likely Republican | 0.00% | |
| 86 | 33.40% | 66.60% | Likely Republican | 0.00% | |
| 84 | 32.10% | 67.90% | Likely Republican | 0.00% | |
| 15 | 31.80% | 68.20% | Likely Republican | 0.60% | |
| 13 | 31.10% | 68.90% | Likely Republican | 0.00% | |
| 110 | 30.90% | 69.10% | Likely Republican | 2.80% | |
| 81 | 30.20% | 69.80% | Likely Republican | 0.00% | |
| 89 | 30.10% | 69.90% | Likely Republican | 0.00% | |
| 97 | 28.40% | 71.60% | Likely Republican | 0.00% | |
| 112 | 27.30% | 72.70% | Likely Republican | 0.00% | |
| 87 | 26.90% | 73.10% | Likely Republican | 0.00% | |
| 80 | 26.80% | 73.20% | Likely Republican | 0.00% | |
| 90 | 26.50% | 73.50% | Likely Republican | 0.00% | |
| 120 | 26.30% | 73.70% | Likely Republican | 0.00% | |
| 77 | 26.00% | 74.00% | Likely Republican | 1.90% | |
| 70 | 25.80% | 74.20% | Likely Republican | 0.00% | |
| 91 | 25.50% | 74.50% | Likely Republican | 0.00% | |
| 94 | 25.20% | 74.80% | Likely Republican | 0.00% | |
| 85 | 24.20% | 75.80% | Likely Republican | 0.00% | |
| 67 | 23.60% | 76.40% | Likely Republican | 3.30% | |
| 78 | 23.30% | 76.70% | Likely Republican | 0.00% |
So, 'likely Republican' districts slightly outnumber the combined 'likely' and 'lean Democratic' seats within this map. Again, this may be due to dispersion of Republican vote patterns across the state, with Democratic vote patterns more concentrated in certain areas.
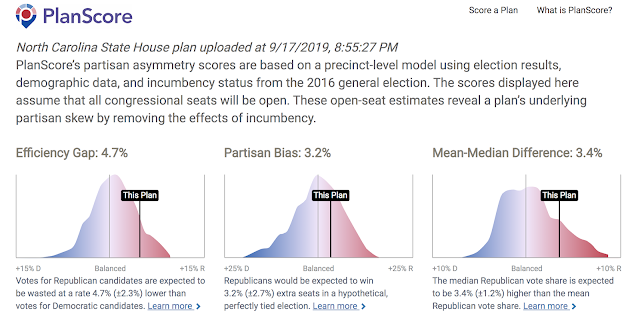
For those interested in how the 2019 NC House map 'scored' on a variety of scales used in redistricting, based on the PlanScore analysis:
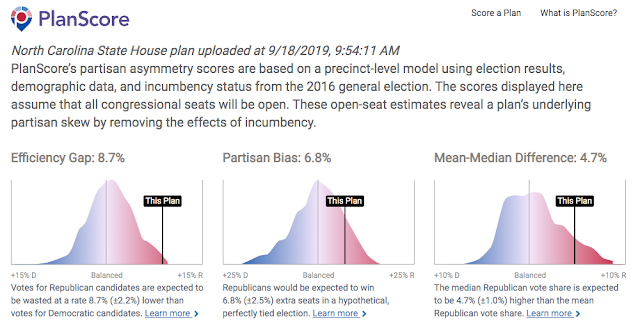
For comparison, the 2018 NC House district plan received the following scores:
As analyzed by PlanScore, the revised 2019 state house maps saw their scores decrease in the efficiency gap, partisan bias, and mean-median differences from the previous 2018 maps.
State Senate Analysis
In the State Senate proposed maps, the districts are:
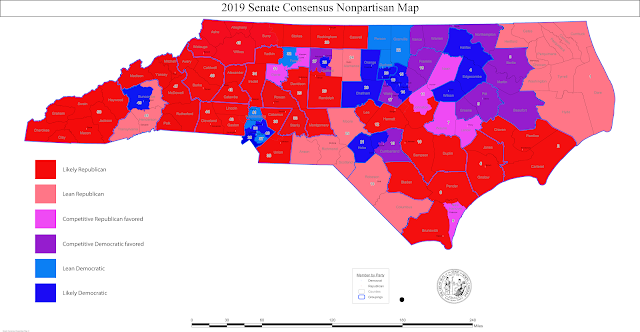
The political data loaded into these districts show the following:
Again, using the same classification scheme as noted for the state house district ("likely," "lean," and "competitive but favor one party), I divided the fifty (50) senate districts into their potential political behavior, based on 2016 election data.
First, the twelve (12) senate districts that could be 'likely' Democratic districts:
| District | Predicted Democratic Vote Share | Predicted Republican Vote Share | Classification | GOP Difference from 2018 | |
| 20 | 83.60% | 16.40% | Likely Democratic | 0.00% | |
| 38 | 80.10% | 19.90% | Likely Democratic | -1.30% | |
| 28 | 75.00% | 25.00% | Likely Democratic | 0.00% | |
| 14 | 73.40% | 26.60% | Likely Democratic | -3.30% | |
| 40 | 72.40% | 27.60% | Likely Democratic | 1.80% | |
| 23 | 68.80% | 31.20% | Likely Democratic | 0.00% | |
| 21 | 66.30% | 33.70% | Likely Democratic | 0.00% | |
| 16 | 64.40% | 35.60% | Likely Democratic | -0.70% | |
| 49 | 60.90% | 39.10% | Likely Democratic | -0.70% | |
| 4 | 60.70% | 39.30% | Likely Democratic | 0.00% | |
| 39 | 60.40% | 39.60% | Likely Democratic | -11.40% | |
| 15 | 60.30% | 39.70% | Likely Democratic | 10.80% |
Next, the four (4) senate districts that fall into the 'lean' Democratic classification:
| District | Predicted Democratic Vote Share | Predicted Republican Vote Share | Classification | GOP Difference from 2018 | |
| 22 | 59.60% | 40.40% | Lean Democratic | 0.00% | |
| 32 | 59.00% | 41.00% | Lean Democratic | 12.40% | |
| 41 | 58.10% | 41.90% | Lean Democratic | -6.40% | |
| 37 | 56.30% | 43.70% | Lean Democratic | 21.70% |
Then, the six (6) 'competitive but Democratic favored' districts:
| District | Predicted Democratic Vote Share | Predicted Republican Vote Share | Classification | GOP Difference from 2018 | |
| 3 | 54.80% | 45.20% | Competitive Democratic Favored | 0.00% | |
| 5 | 53.30% | 46.70% | Competitive Democratic Favored | 0.00% | |
| 17 | 52.70% | 47.30% | Competitive Democratic Favored | -3.90% | |
| 27 | 51.30% | 48.70% | Competitive Democratic Favored | -3.00% | |
| 18 | 51.00% | 49.00% | Competitive Democratic Favored | -2.70% | |
| 19 | 51.00% | 49.00% | Competitive Democratic Favored | 0.00% |
All together, these potential Democratic-oriented senate districts total twenty-two (22), with a majority being 26 in the chamber.
Among the four (4) 'competitive but Republican favored' districts:
| District | Predicted Democratic Vote Share | Predicted Republican Vote Share | Classification | GOP Difference from 2018 | |
| 9 | 48.60% | 51.40% | Competitive Republican Favored | -0.80% | |
| 7 | 47.10% | 52.90% | Competitive Republican Favored | 0.00% | |
| 11 | 45.90% | 54.10% | Competitive Republican Favored | -2.60% | |
| 31 | 45.90% | 54.10% | Competitive Republican Favored | -8.40% |
Then, the five (5) 'lean Republican' districts:
| District | Predicted Democratic Vote Share | Predicted Republican Vote Share | Classification | GOP Difference from 2018 | |
| 24 | 44.70% | 55.30% | Lean Republican | 0.00% | |
| 13 | 44.30% | 55.70% | Lean Republican | 0.00% | |
| 1 | 43.80% | 56.20% | Lean Republican | 0.00% | |
| 25 | 43.40% | 56.60% | Lean Republican | 0.00% | |
| 48 | 40.20% | 59.80% | Lean Republican | 0.30% |
Finally, the nineteen (19) state senate districts that could be classified as 'likely Republican':
| District | Predicted Democratic Vote Share | Predicted Republican Vote Share | Classification | GOP Difference from 2018 | |
| 36 | 40.00% | 60.00% | Likely Republican | 0.00% | |
| 12 | 39.60% | 60.40% | Likely Republican | 0.20% | |
| 8 | 38.40% | 61.60% | Likely Republican | 0.60% | |
| 10 | 37.20% | 62.80% | Likely Republican | 2.40% | |
| 35 | 36.70% | 63.30% | Likely Republican | 0.00% | |
| 43 | 36.40% | 63.60% | Likely Republican | 0.00% | |
| 2 | 35.20% | 64.80% | Likely Republican | 0.00% | |
| 6 | 34.10% | 65.90% | Likely Republican | 0.00% | |
| 50 | 33.10% | 66.90% | Likely Republican | 0.00% | |
| 30 | 32.50% | 67.50% | Likely Republican | 0.00% | |
| 45 | 32.10% | 67.90% | Likely Republican | 0.00% | |
| 26 | 31.90% | 68.10% | Likely Republican | 4.50% | |
| 44 | 31.80% | 68.20% | Likely Republican | 0.00% | |
| 42 | 31.30% | 68.70% | Likely Republican | 0.00% | |
| 33 | 31.10% | 68.90% | Likely Republican | 0.00% | |
| 34 | 30.30% | 69.70% | Likely Republican | 0.00% | |
| 47 | 29.70% | 70.30% | Likely Republican | 0.00% | |
| 29 | 29.30% | 70.70% | Likely Republican | 0.00% | |
| 46 | 27.80% | 72.20% | Likely Republican | 0.00% |
Again, taking the potential Republican seats and using electoral data from the 2016 election, 28 senate districts would be GOP districts.
For those interested in what PlanScore's redistricting analysis shows for the 2019 map (for some reason, the website was not loading the histogram chart for either plan):
Here are the comparison scores for the 2018 state senate map (again, without the histogram chart details, for some reason):
As with the state house revised maps, the revised 2019 senate maps saw a decrease in the efficiency gap, partisan bias, and mean-median differences from the 2018 senate maps.
Now, we await the three judges to review and make their own determination, likely with the assistance of a special master. Again, these maps are not set in stone, pending potential revision or changes by the court before the 2020 election cycle begins with December's candidate filing period.
One more important reminder: this analysis does not predict whether a district will elect a Democrat or Republican candidate. It simply uses 2016 election data to indicate where the potential district may lie in political 'behavior' based on analysis by PlanScore.
If you have studied North Carolina politics and voting patterns for any length of time, you will know that the Old North State is undergoing a significant shift in voting patterns, especially on the 'regional' aspect and within the 'generational cohort' aspect. Since 2008, each of North Carolina's elections have tended to have "a mind of its own" and 2020 is likely to continue that pattern--that is one prediction I'll be willing to stick with in the future.
